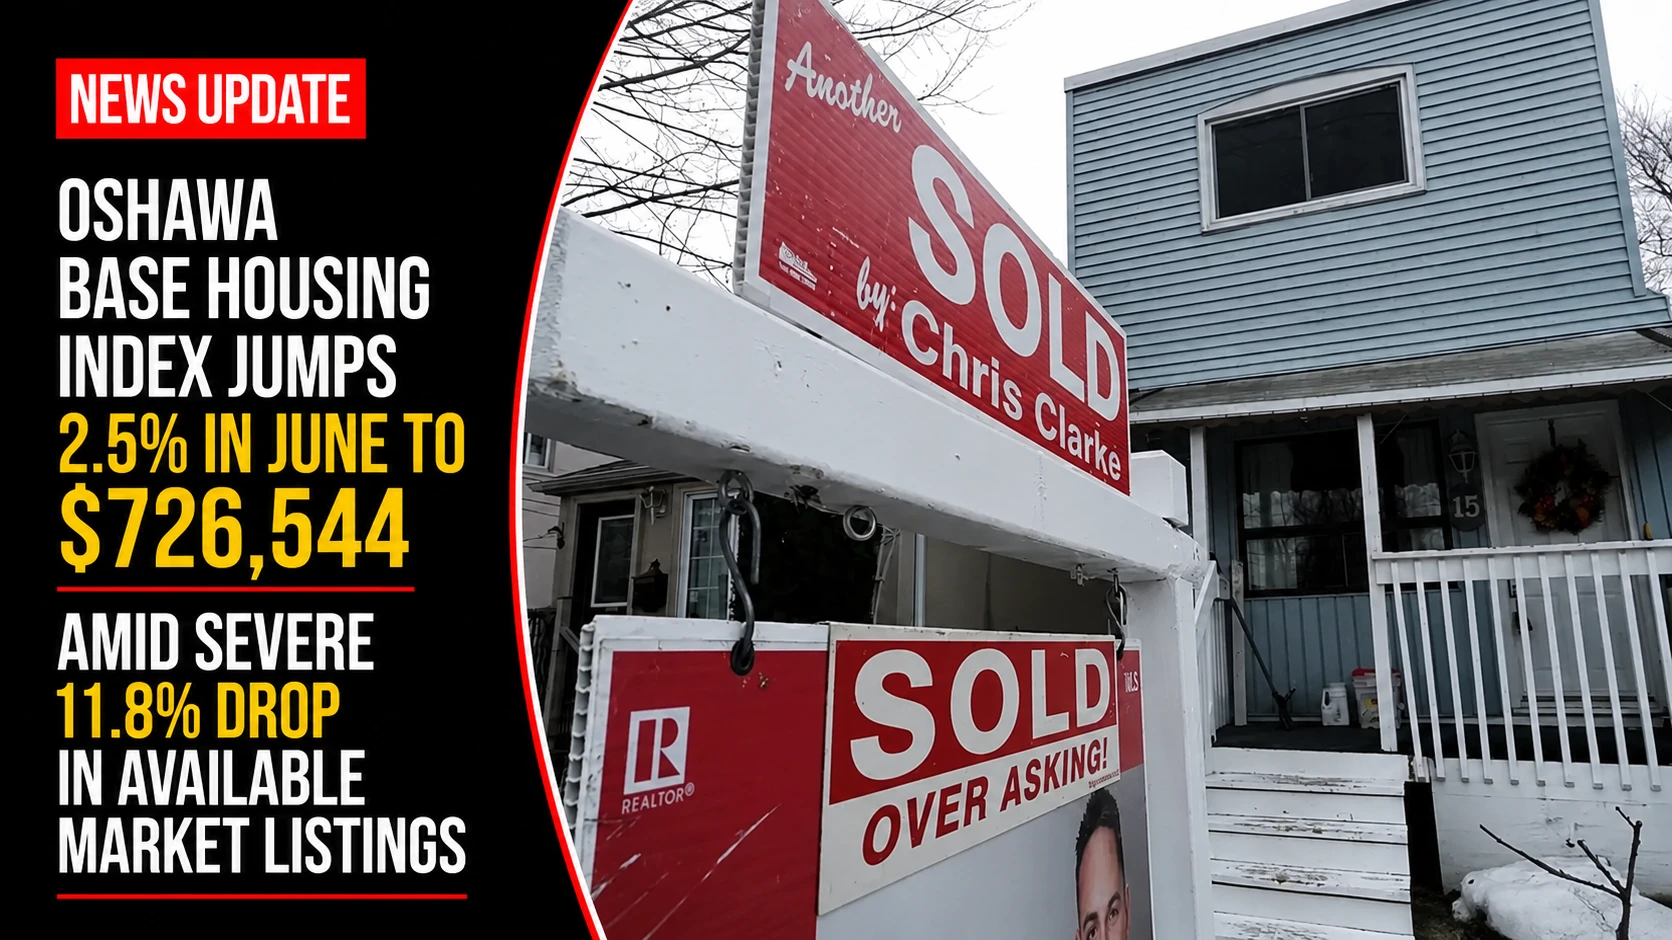
The municipal tax assessment divisions, residential construction grids, and consumer banking desks within the Durham Region are updating local valuation indices. Tracked under provincial macroeconomic and local asset development portfolios on Monday, July 13, 2026, real estate ledger teams finalized the monthly baseline report Oshawa home prices jump 2.5 per cent to $726,544 in June 2026. Data authenticated by the Toronto Regional Real Estate Board (TRREB) reveals a distinct month-over-month price consolidation, driven primarily by a tightening supply loop that has systematically reduced local inventory layers across the municipality.
Market analysts note that while short-term pressure squeezed prices upward by $17,821 from May, the macroscopic annualized curve reflects a broader cyclical correction, leaving average values five percent below historical mid-summer peaks recorded in 2025.


The Structural Asset Class Breakdown and Inventory Constraints
The early summer real estate footprint is characterized by highly irregular performance lines between specialized housing formats, with multi-unit condo arrays bearing the largest value drops.


-
The Velocity and Volume Loop: Total municipal transactions settled at 181 completed sales across the month, operating under a firm balanced market baseline. Active properties spent an average of 23 days on the market before clearing the transaction sheets.
-
The Inventory Deficit: Total active inventory contracted sharply to 686 open listings by the end of the month, representing a steep 11.8 percent plunge compared to the supply pools available during the same interval last year.
-
The Semi-Detached Anomaly: Bucking the broader downward trend seen in detached and condo classes, semi-detached formats saw a strong 5.1 percent month-over-month surge, closing at an average of $630,933 as buyers seek out entry-level freehold options.
-
The High-Density Condo Drop: High-density apartment-style condos experienced severe downward adjustments, dropping 13.9 percent in a single month to rest at an average of $316,000—representing a massive 27.3 percent year-over-year deflation from 2025 values.
Analyzing the Property Class Performance and 10-Year Growth Matrix
The monthly TRREB data sets show a clear divide between historical long-term capital appreciation and short-term micro-market fluctuations.
| Property Segment | Average June 2026 Price | Monthly Valuation Delta | Annual Price Delta (vs. June 2025) | 10-Year Growth Trajectory (vs. June 2016) | Active Monthly Inventory |
| Detached Houses | $788,249 | -0.7% (↘ Easing) | -6.8% (↘ Down $57,756) | +$311,193 absolute increase | 423 listings (22 days on market) |
| Semi-Detached Houses | $630,933 | +5.1% (↗ Surging) | -4.1% (↘ Down $26,661) | +$275,317 absolute increase | 56 listings (17 days on market) |
| Attached Freeholds | $649,671 | -5.0% (↘ Easing) | -8.8% (↘ Down $62,686) | +$233,738 absolute increase | 62 listings (32 days on market) |
| Townhouse Condos | $509,700 | -6.9% (↘ Easing) | -4.7% (↘ Down $25,094) | +$274,228 absolute increase | 71 listings (33 days on market) |
| Apartment Condos | $316,000 | -13.9% (↓ Sharp Drop) | -27.3% (↓ Steep Plunge) | +$42,827 absolute increase | 67 listings (37 days on market) |
The Toronto Regional Real Estate Board (TRREB) and partner local real estate brokerages handle ongoing automated data mining, transaction indexing, and market velocity metrics.
Oshawa homeowners, prospective property buyers, and financial investment managers looking to review neighborhood-specific zoning price grids, download complete historical market watch pdf ledgers, or access first-time homebuyer grant applications can find the data platforms online through the central Toronto Regional Real Estate Board market watch portal, explore local listings via the REALTOR.ca network, or track regional economic updates through the Durham Region business index.