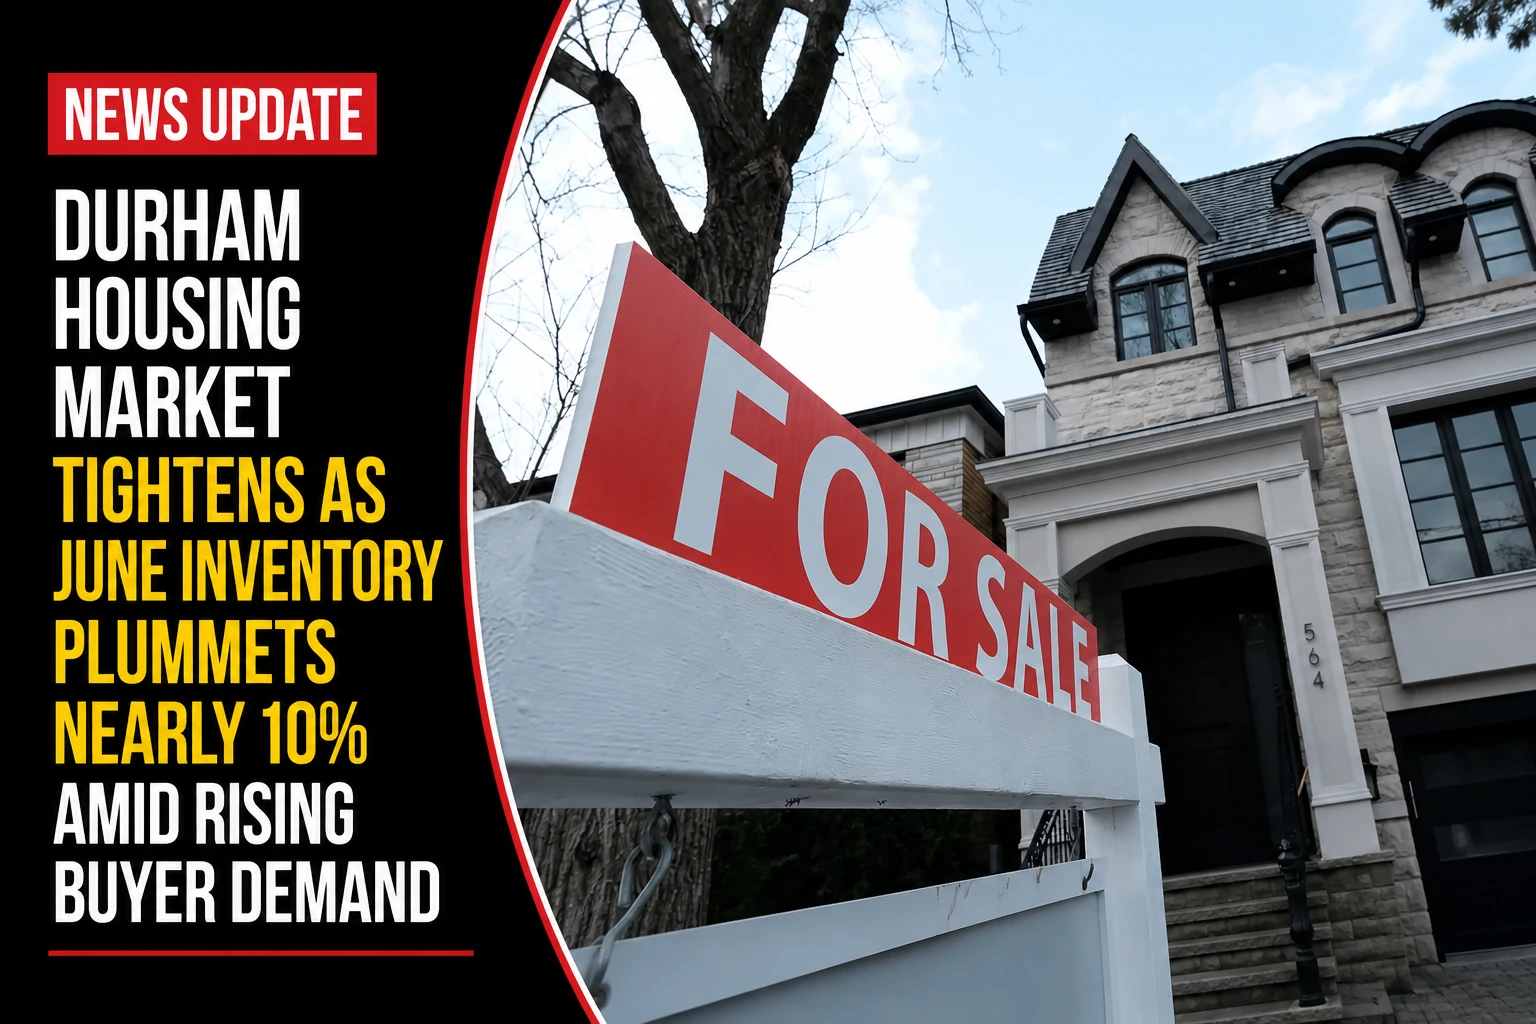
The municipal finance committees, regional residential real estate brokerages, and residential development portfolios within the Durham Region are analyzing a stark structural pivot. Tracked under regional economic data registries on Tuesday, July 7, 2026, market analysts finalized the monthly inventory ledger Durham Region home prices climb 0.6 per cent to $856,170 in June 2026. Transitioning smoothly into the back half of the fiscal year, Durham’s real estate ecosystem is signaling a steady, short-range rebound. While average prices softened slightly against last summer’s peaks, an aggressive month-over-month price bump paired with a large-scale inventory contraction shows that buying competition is intensifying quickly across the region.
Market analysts note that the local price floor is solidifying rapidly as dropping inventory gives sellers greater leverage at the negotiating table.


The June 2026 Macro Real Estate Architecture
The current monthly metrics showcase a highly resilient local sector, with listings clearing at a steady clip as buyer pools expand.


-
The Average Price Matrix: The consolidated average cost for a residential property across Durham hit $856,170 in June. This marks a short-range lift of 0.6 percent (or a flat $5,105 gain) directly over May 2026, though the market is still down 4 percent against the higher baselines of June 2025.
-
The Velocity of Sales: A total of 849 homes changed hands across the regional MLS grid during the month, representing a 3.9 percent increase in transaction volume compared to the same period last year.
-
The Supply Squeeze: Active available listings dropped significantly, wrapping up the month at 2,637 units. This represents a sharp 9.8 percent drop in active inventory year-over-year, indicating that incoming supply is failing to match current consumption rates.
-
The Market Turnaround Time: Across all property categories, listings spent an average of 24 days on the market before firming up their sale contracts.
Analyzing Property Segments and 10-Year Growth Rates
The detailed property-type matrix highlights how different housing categories performed during the June cycle.
| Property Segment & Style | Average Traded Value | Active Inventory Units | Average Days on Market | 10-Year Absolute Value Growth (Since June 2016) |
| Detached Houses | $961,793 | 1,714 Active Units | 22 Days on Market | +$367,504 Capital Appreciation |
| Attached Freeholds | $736,845 | 320 Active Units | 26 Days on Market | +$271,952 Capital Appreciation |
| Semi-Detached Units | $718,689 | 120 Active Units | 16 Days on Market | +$285,009 Capital Appreciation |
| Townhouse Condos | $577,720 | 224 Active Units | 31 Days on Market | +$247,404 Capital Appreciation |
| Apartment Condos | $483,250 | 218 Active Units | 38 Days on Market | +$154,586 Capital Appreciation |
The Analytical Real Estate Perspective
Real estate investment groups emphasize that the 57.9 percent macro value explosion tracked over the last decade proves Durham remains an economic powerhouse within the outer Greater Toronto Area. TRREB executives note that the market’s current performance aligns closely with their “year of two halves” forecast. After a quiet start to the spring, dropping interest rates have brought buyers back into the fold, and the tightening inventory levels point toward continued price growth heading into the fall.
The Toronto Regional Real Estate Board manages all centralized data pipelines and MLS systems for these figures.
Durham Region property sellers, mortgage brokers, and prospective buyers looking to look over local neighborhood sales maps, download historical pricing spreadsheets, or track municipal land transfer taxes can access the main data networks online at trreb.ca, wowa.ca, or track localized real estate market analyses via durhamregion.com.