









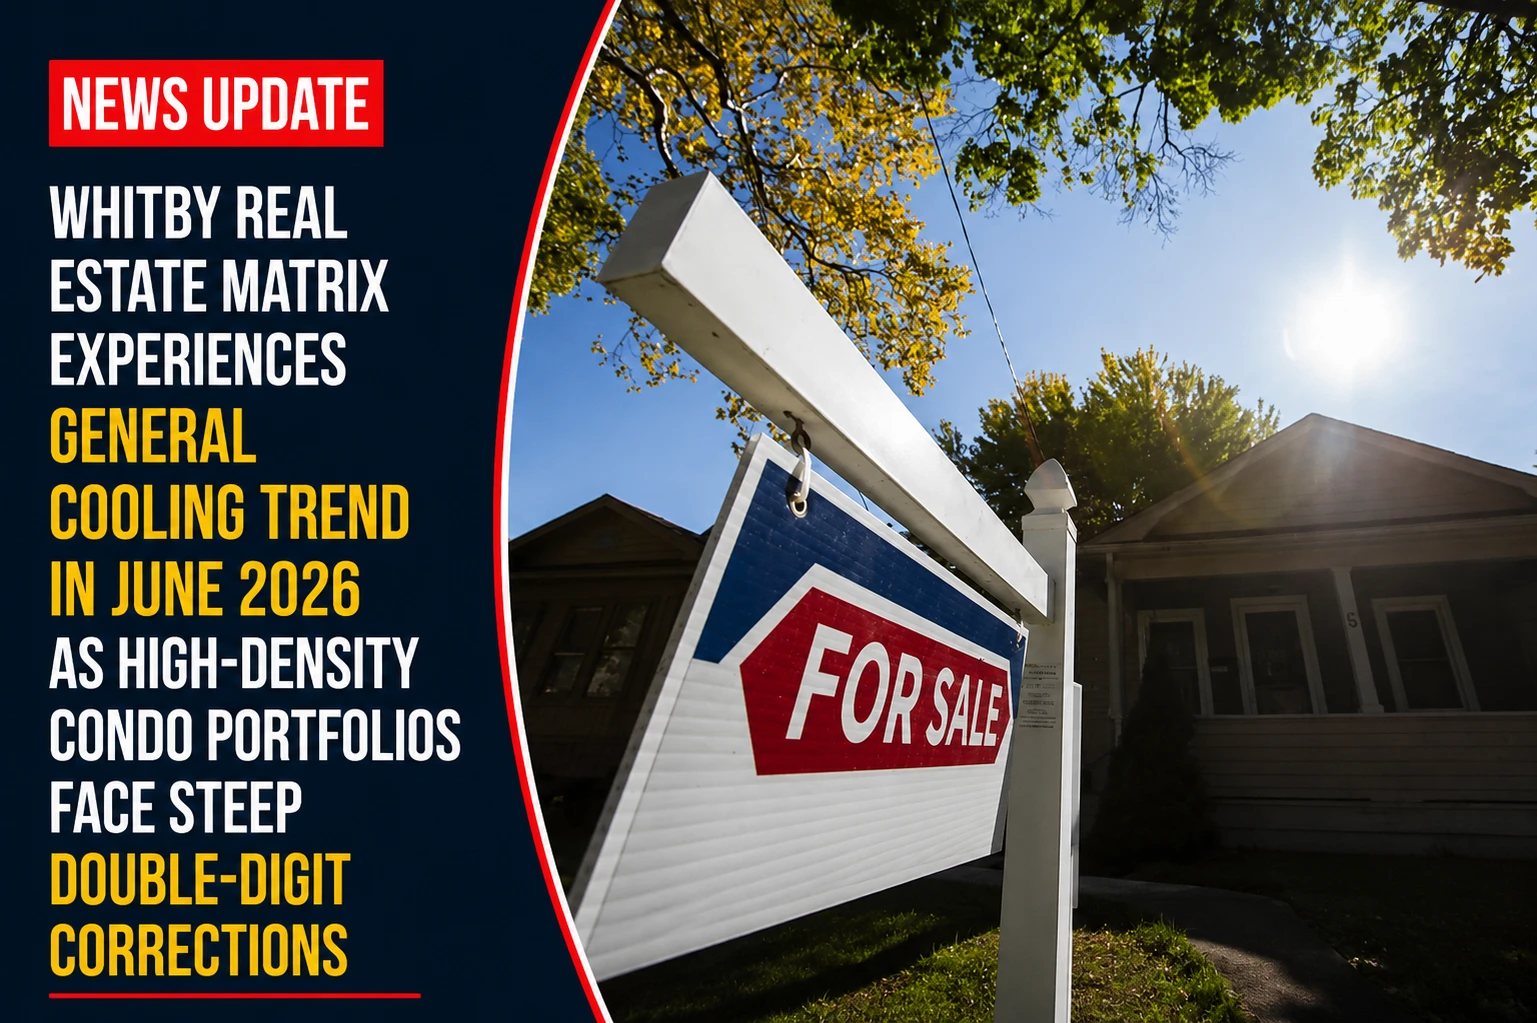
The residential development markets, financial loan portfolios, and property brokerage networks within the Durham Region are re-calibrating their multi-year investment baselines. Tracked under provincial economic trends, municipal real estate data, and housing inventory metrics on Wednesday, July 15, 2026, real estate market analysts finalized the comprehensive residential data log Whitby home prices drop 1.4 per cent to $936,392 in June 2026. The market summary, compiled from automated transaction registries maintained by the Toronto Regional Real Estate Board (TRREB), profiles a shifting mid-summer landscape characterized by shrinking overall sales volumes alongside a noticeable contraction in active listing inventories compared to the same operational stretch last year.
Housing research technicians point out that while low-density freehold attached houses managed to buck the trend with positive month-over-month price growth, the high-density condominium market sectors—encompassing both standard apartment blocks and townhouse configurations—saw sharp, double-digit monthly and annual pullbacks.


The Overall June 2026 Housing Grid and Inventory Contraction
The broad real estate index indicates an evolving supply-demand dynamic across the town’s primary residential sectors.


-
The Baseline Average: The overall average price across all combined housing profiles dropped to $936,392. This represents a month-over-month decrease of 1.4% (-$13,265) from May 2026, and a year-over-year dip of 2.6% (-$24,900) compared to June 2025.
-
The Sales Volume Decline: Buyers closed on a total of 168 home sales throughout the month, marking an 11.1% decline in overall activity compared to June of last year.
-
The Days on Market Horizon: Properties required an average operational tracking window of 24 days on the open market to secure a binding sale agreement.
-
The Supply Drop: Total active listing inventory fell to 417 homes by the end of the month, representing a significant 17.3% contraction in available property supply compared to June 2025.
Analyzing the Property Segment Matrix and 10-Year Growth Milestones
The individual housing classifications show a clear division between resilient low-density forms and softening high-density condo stocks, though 10-year tracking demonstrates substantial long-term equity growth across every category.
| Housing Segment Category | June 2026 Average Value | MoM Price Change Tracking | Active Month-End Listings | Avg. Days on Market | 10-Year Absolute Value Gain(June 2016 vs. June 2026) |
| Detached Houses | $1,070,000 | ↘ Down 0.5% (–$5,283) | 241 Active Units | 23 Days | ▲ $418,938 Increase |
| Semi-Detached Houses | $823,041 | ↘ Down 0.6% (–$4,600) | 15 Active Units | 14 Days | ▲ $369,158 Increase |
| Attached Houses | $802,206 | ↗ Up 3.4% (+$26,593) | 80 Active Units | 26 Days | ▲ $327,058 Increase |
| TownhouseCondos | $570,850 | ↘ Down 12.6% (–$82,275) | 25 Active Units | 15 Days | ▲ $215,834 Increase |
| Apartment Condos | $512,262 | ↘ Down 12.4% (–$72,628) | 40 Active Units | 36 Days | ▲ $158,280 Increase |
The Toronto Regional Real Estate Board (TRREB) Data Insights Unit, the Ontario Real Estate Association (OREA) Compliance Branch, and individual local brokerage firms handle ongoing transaction indexing, historical valuation tracking, and monthly market reports.
Whitby homebuyers, current property owners, and corporate real estate investors looking to download complete sub-neighborhood pricing maps, track regional sales volume charts across the wider GTA, or explore historical TRREB market data logs can access the information online through the central Toronto Regional Real Estate Board portal at www.trreb.ca, review local housing statistics via the Ontario Real Estate Association site, or monitor community economic development metrics through the Durham Region public dashboard.