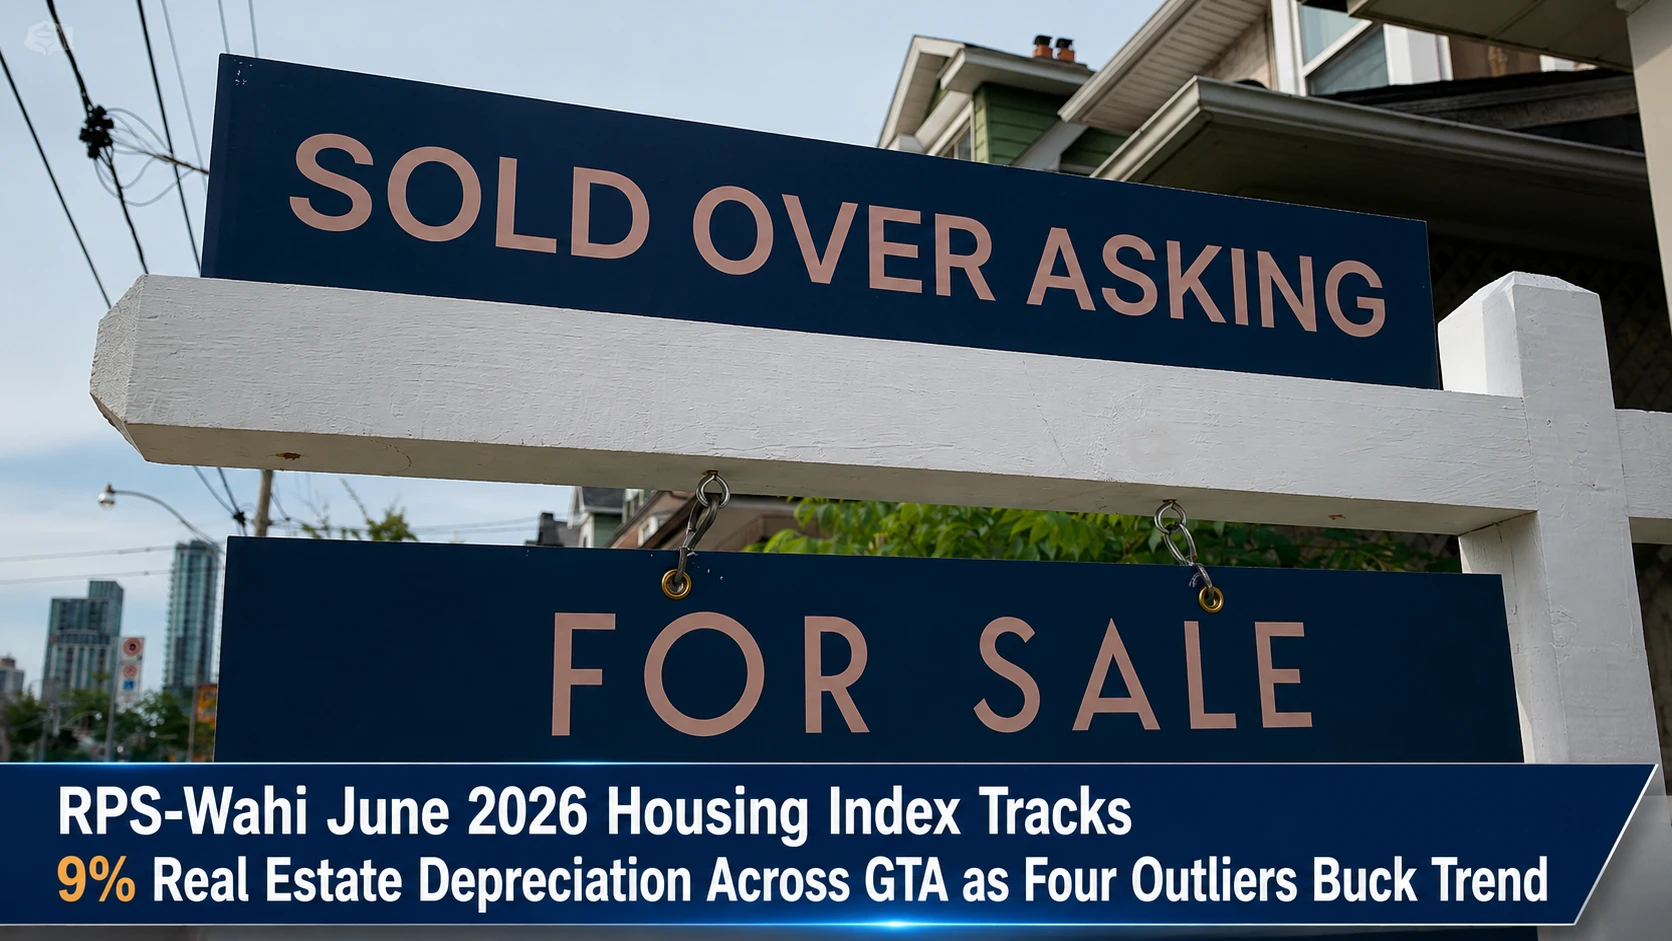
The municipal planning boards, real estate associations, and public finance monitoring groups within the Durham Region are analyzing a starkly divided national housing market. Tracked under macroeconomic real estate trends, provincial consumer behavior, and municipal development portfolios on Friday, July 17, 2026, housing data analysts finalized the market ledger Significant home price increases reported in 4 Canadian cities. The latest actual home values across 1,000 towns and cities compiled for the national Real Property Solutions (RPS)-Wahi House Price Index confirmed that despite a highly favorable and stable low-interest-rate environment, economic uncertainty continues to park prospective home buyers on the sidelines, forcing deep corrections across high-exposure Ontario and British Columbia metropolitan grids.
However, the comprehensive analysis revealed four distinct regional metropolitan anomalies that are successfully resisting the broader downturn due to strong supply limitations and relative entry-level affordability.
The National Pullback Pace and the Condo Correction Gap
The real estate performance records highlight a widening geographic divide between major Canadian real estate markets:
-
The Year-over-Year National Slide: On a national scale, actual home values fell by 3 per cent on a year-over-year basis in June 2026. This marks a fractional deceleration from the 4 per cent year-over-year depreciation rate tracked in May, reinforcing a steady, multi-month stabilization path.
-
The Greater Toronto Area Downturn: The data networks indicate that real estate prices across metro Toronto—including the highly integrated Durham Region baseline—are dropping rapidly, registering a 9 per cent year-over-year price decline.
-
The Multi-Family Inversion: RPS-Wahi economist Ryan McLaughlin attributed the sharp GTA downswing primarily to an aggressive multi-family condo market correction. This structural segment correction is significantly larger than the correction playing out in Vancouver, causing metro Toronto prices to fall nearly twice as fast as metro Vancouver’s 5 per cent drop.
-
The Buyer Inaction Factor: McLaughlin noted that under typical historic cycles, low and predictable interest rates trigger rapid buyer influxes. Instead, lingering broader economic headwinds have kept localized consumers highly cautious, stalling a wider market recovery.
Analyzing the Top National Outliers and Major Metro Real Estate Spreads
Among the 13 primary metropolitan areas heavily audited by the index, only four recorded significant price increases, driven by tight inventories.
| Metropolitan Market Region | June 2026 Year-over-Year Index Trajectory | Historical Growth Milestones & Drivers | Local Inventory & Supply Market States | Core Regional Catchment Affordability Profile |
| Quebec City |
+10% Price Increase (National Growth Leader) |
Overtook the hot Calgary housing grid in September 2024 to lock in the top spot. | Facing intense supply blockages and structural product shortages. | Maintains high relative affordability compared to southern Ontario lines. |
| Montreal |
+7% Price Increase (Second-Place Nationally) |
Steady secondary market acceleration sustaining over consecutive quarters. | Low active listing inventory failing to meet baseline baseline buyer demand. | Balanced metropolitan pricing encouraging persistent domestic purchases. |
| Saskatoon |
+5% Price Increase (Tied for Third-Place) |
Accelerated Prairie asset migration driven by secondary economic sectors. | Extremely low listing turnover causing tight competition among available properties. | Highly resilient entry-level thresholds drawing out-of-province interest. |
| Winnipeg |
+5% Price Increase (Tied for Third-Place) |
Consistent upward pricing trajectory insulated against multi-family corrections. | Persistent supply challenges choking standard detached home access points. | Strong regional value supporting local household transitions. |
The Real Estate Operations and Consumer Advisory Directives
“With interest rates low and stable for some time now, a broader market turnaround may have been expected, but it seems that economic uncertainty is keeping more homebuyers on the sidelines,” stated RPS-Wahi economist Ryan McLaughlin, highlighting that the national index continues to be dragged down heavily by Ontario and British Columbia listings. Regional housing planners emphasize that because the local Durham market is undergoing a necessary rebalancing act following the peak valuations of previous years, buyers and sellers must adjust their pricing expectations to match current conditions. Sellers navigating the local townhome and condo markets must price assets realistically from day one, while buyers are urged to focus on long-term household affordability metrics rather than speculating on short-term market spikes.
The Real Property Solutions (RPS) Analytical Division, the Wahi Real Estate Intelligence Platform, the Toronto Regional Real Estate Board (TRREB), and individual Durham municipal housing committees handle ongoing price index logging, local sales volume tracking, and property appraisal modeling.
Durham homebuyers, property investors, and local real estate brokers looking to view the complete, unedited June 2026 housing index, download localized median property values for Whitby, Oshawa, and Clarington, or review the historical index baseline database starting from 2005 can locate the platforms online through the central Wahi market insights hub at www.wahi.com, access advanced automated valuation files via the central Real Property Solutions portal at www.rpsrealsolutions.com, or monitor local transaction histories through the TRREB data network.