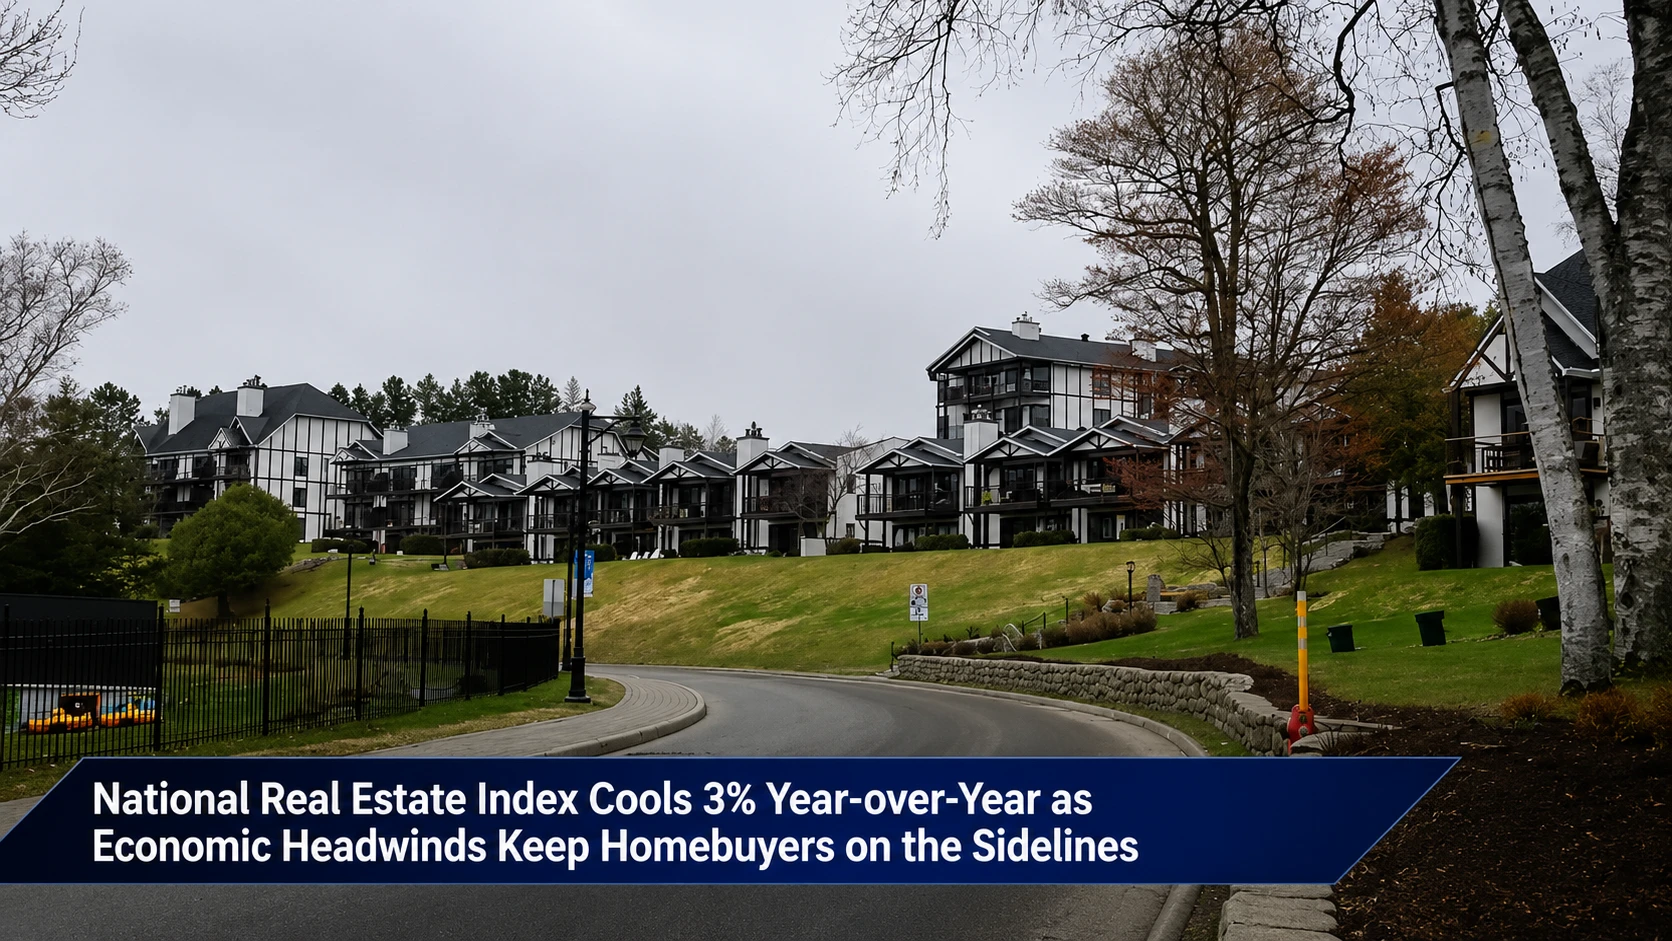
The real estate boards, mortgage brokerage networks, and urban development committees within the Durham Region are analyzing a major shift in market dynamics. Tracked under provincial economic trends, national property evaluations, and local housing portfolios on Wednesday, July 15, 2026, real estate research analysts finalized the market assessment Home prices sputter despite friendly interest rate regime. Data released by prop-tech platform Wahi and national property valuation provider Real Property Solutions (RPS) reveals that the traditional relationship between interest rates and real estate has fractured. Despite a stable and supportive interest rate climate, economic uncertainty has locked prospective buyers into a holding pattern.
Economists emphasize that while past cycles saw lower rates immediately spark a surge in sales volume and property values, current buyers are exercising historic levels of caution due to broader macroeconomic headwinds.
The National Index Contraction and the Buyer Caution Index
The monthly actual home value metrics from over 1,000 Canadian cities paint a picture of quiet open markets:
-
The Year-over-Year Slide: The national RPS-Wahi House Price Index fell by 3% year-over-year in June 2026, marking a subtle deceleration from the 4% annual drop registered in May.
-
The Tariff Exposure Factor: Average prices dropped most sharply in a dozen of the country’s most tariff-exposed industrial and manufacturing municipalities, highlighting how trade vulnerability directly spills into local residential equity.
-
The CAUTIOUS Buyer: Highlighting the psychological shift in the market, a recent RBC consumer poll cited by RPS-Wahi revealed that three-quarters (75%) of prospective buyers planning to purchase over the next two years are moving with heightened caution due to overall economic volatility.
-
The Sales-to-Price Lag: While raw transaction volumes did see a modest, localized uptick in the Greater Toronto and Vancouver regions last month, the absolute velocity of sales remains well below long-term historic averages, failing to generate enough momentum to reverse downward pricing curves.
Analyzing the Metro Area Growth Exceptions and Segment Depreciation
A distinct geographic divergence has emerged across Canada’s 13 major metropolitan areas, splitting high-cost coastal markets from affordable mid-country alternatives.
| Market Region / Node | Annual Price Change (June 2026) | Primary Housing Types Affected | Key Economic Driver / Market Dynamic | Current Inventory & Supply Status |
| Quebec City | ▲ 10% Increase | Mid-density freehold homes. | Has consistently led all major Canadian cities in price growth since September 2024. | Severe inventory shortage matching high local demand. |
| Montreal | ▲ 7% Increase | Condominiums and attached homes. | Strong regional economic stability and relative price entry points. | Solid demand meeting tight mid-city supply curves. |
| Saskatoon & Winnipeg | ▲ 5% Increase (Each) | Detached houses and townhomes. | Represents the Prairie region’s primary affordability hubs. | Balanced inventory with minor supply-side friction. |
| Calgary & Edmonton |
Sideways Momentum (Calgary: -1% | Edmonton: +1%) |
Multi-family housing and townhouses. | Cools from the double-digit percentage gains recorded throughout 2025. | Market has shifted back into a highly balanced neutral zone. |
| Greater Vancouver | ↘ 5% Decrease | Condominium and row-housing. | Shifting immigration policies and high absolute entry costs. | Active inventory slowly building as buyer pool shrinks. |
| Greater Toronto Area | ↘ 9% Decrease | High-density entry-level condos. | Massive completed condo inventory hitting the market simultaneously. | The severe condo correction (-7%) represents the weakest segment in Canada. |
The Macroeconomic Housing and Condo Market Directives
“With interest rates low and stable for some time now, a broader market turnaround may have been expected, but it seems that economic uncertainty is keeping more homebuyers on the sidelines,” stated RPS-Wahi Economist Ryan McLaughlin. McLaughlin noted that the multi-family sector is bearing the brunt of the downturn, with condominiums (-7%) and row/townhouses (-8%) standing as the fastest-depreciating housing types nationwide. Even historically insulated single-family homes are feeling the squeeze, with detached properties dropping 3% and semi-detached homes falling 4% year-over-year. This widespread cooling suggests that until consumer confidence stabilizes and the massive backlog of recently completed urban condo projects is absorbed, pricing trends across major Ontario hubs will continue to trend downward.
The Toronto Regional Real Estate Board, the Canadian Real Estate Association (CREA), and the Canada Mortgage and Housing Corporation (CMHC) handle ongoing transaction indexing, mortgage rate tracking, and regional housing start monitoring.
Durham buyers, sellers, and local real estate professionals looking to view detailed historical pricing maps for Whitby, Oshawa, and Pickering, download local neighborhood bidding-war indices, or review regional MLS sales volume sheets can access the systems online through the central Wahi market insights portal at www.wahi.com, monitor national indices via the Real Property Solutions HPI tracker at www.rpsrealsolutions.com, or check regional economic development indicators through the Durham Region public dashboard.