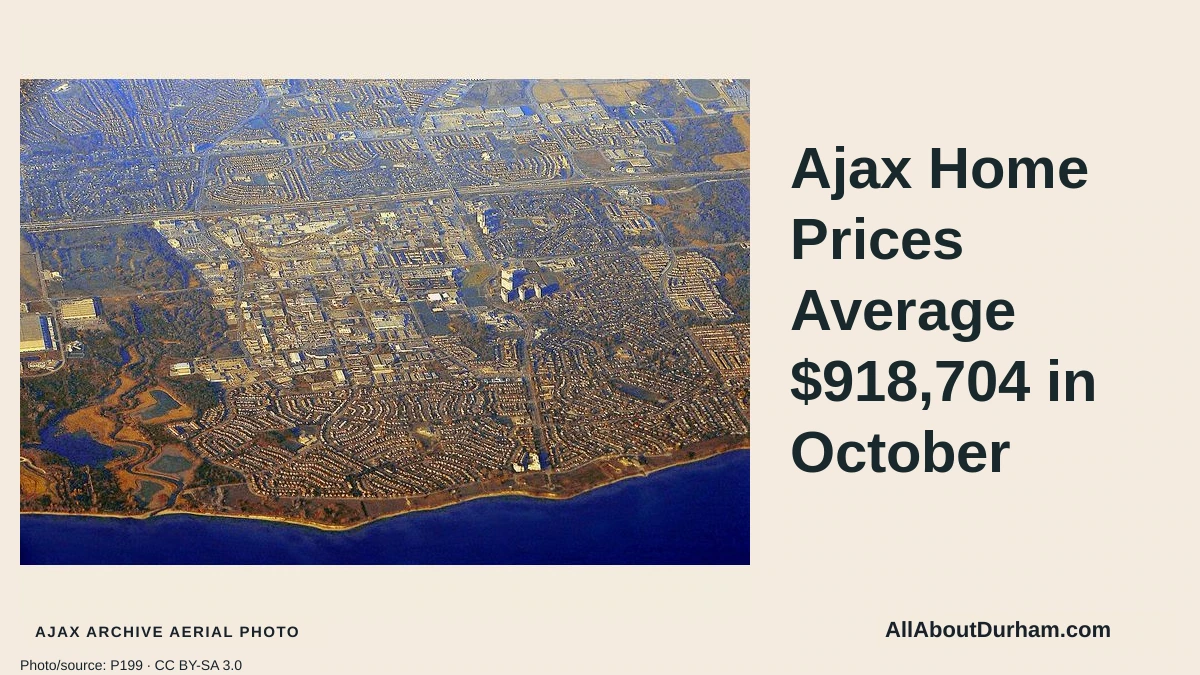
Ajax home prices averaged $918,704 in October 2026, as 74 residential properties changed hands and the town ended the month with 304 active listings, according to Toronto Regional Real Estate Board data.
The board’s October Market Watch tables put the median selling price at $812,750. Completed sales had a combined value of $67,984,089 and an average listing period of 30 days.
DurhamRegion.com’s November 16 analysis reported the average was 10.8 per cent above September and 1.5 per cent above October 2025. It also reported that sales were 27.5 per cent lower than a year earlier, while active listings were up 9.7 per cent.
Detached houses accounted for most sales
Detached homes represented 59 of the 74 transactions. Their average selling price was $993,878, with a median of $846,000. There were 192 active detached listings at month-end, and completed detached sales spent an average of 31 days on the market.
The town recorded two semi-detached sales averaging $710,500. Five attached-house transactions averaged $682,180, with a median selling price of $680,000.
Condominium categories had small samples
Three townhouse-style condominiums sold for an average of $553,963. The board recorded 32 active listings in that category at the end of October.
Four apartment-style condominium sales averaged $528,125, with 15 active listings. TRREB lists linked houses separately: one linked property sold for $739,000.
Those small transaction counts matter when comparing category averages from month to month. A handful of different properties can change an average without showing how the value of every home has moved.
A monthly snapshot
The Ajax home prices figures describe completed transactions reported for October, rather than asking prices for all available properties. The average and median are different measures: the former reflects the total value of sales divided by the number sold, while the latter identifies the middle sale.
TRREB notes that historical figures can change as additional listings and transactions are incorporated into its data system. This report uses the October municipal tables for the current totals and attributes the month-to-month and annual comparisons to DurhamRegion.com’s analysis.